SeismoSpin is a novel interactive instrument designed around a Disc Jockey metaphor that gives seismologists a quick and powerful way to explore earthquake data.
PAPER
- SeismoSpin: A Physical Instrument for Digital Data, short paper at CHI 2003
PHOTOS
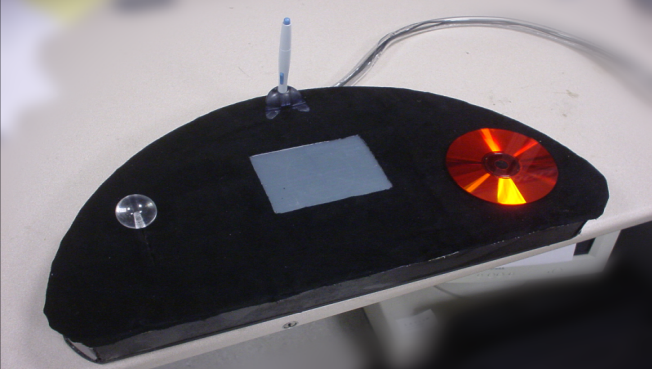
Controller: slider, tablet, and disc.
Raise or lower the slider to adjust the temporal zoom level; rotate the disc to advance or rewind time; point to or draw earthquakes and fault lines using the pen and tablet.
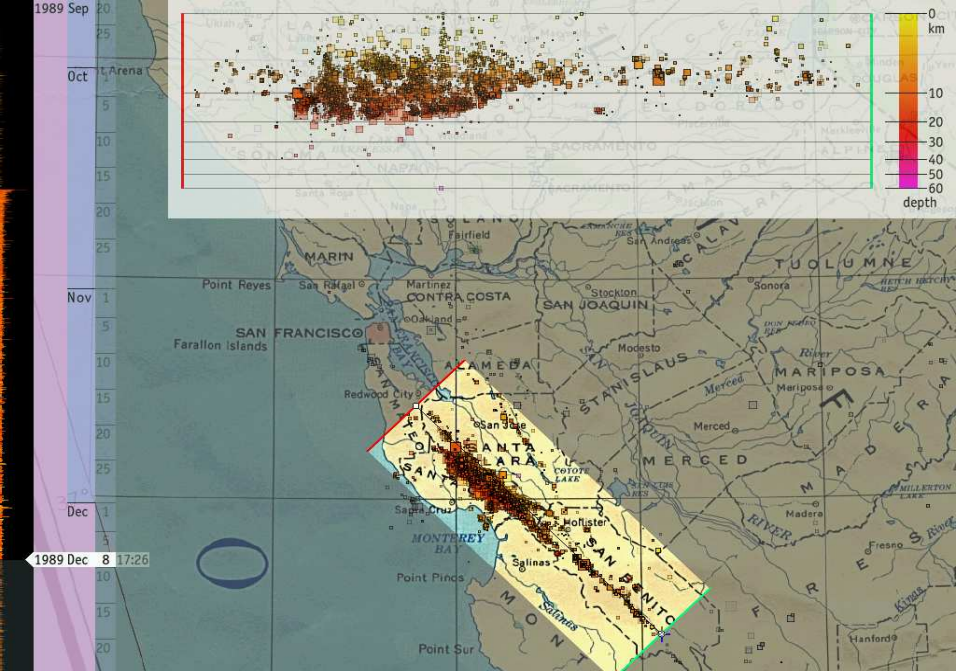
Screenshot of the viewer.
The black vertical bar on the left shows total California earthquake activity over time, with the currently viewed moment indicated by the white pointer. The vertical time bars show years, months, days, hours, and minutes, with pink sections highlighting the current year, month, and day. Manipulating the time slider causes the time bars to expand or contract, and bars to fade in or fade out to show an appropriate level of time detail.
Earthquakes on the map are sized by magnitude and coloured by depth. The user has used the pen to draw a cross-section box, the highlighted diagonal rectangle. At the top of the map, a corresponding view shows the depth of all the earthquakes within the box.